
Have you taken over a web application that’s currently in flames? Or has your startup finally started gaining traction, but it’s struggling to handle the new load from customers? Even if you’re not experiencing problems now, there’s a good chance that implementing some basic monitoring will expose issues with your site that are impacting your users, your code’s correctness or your bottom line.
If your sole experience has been doing development work, these can be particularly tough challenges to deal with… Operations is a big field with a huge set of tools that can take a while to get up to speed on. It doesn’t help that you might be having to learn about and implement these tools while under duress. You will probably have a lot of questions when you’re first getting started.
- What is worth monitoring?
- What tools are at my disposal?
- What problems do those tools help me solve?
- What should I add monitoring around first?
I’m going to answer some of these questions below based on my experience operating Leafly, ranked 1,112 on Alexa at the time of writing and serving around 750 million requests per month when I was last working there.
This is for developers that need to get a real quick handle on operations.
Must-Haves
Below you’ll find the bare minimum monitoring solutions I’d suggest having in place, in order of what I think is most important to implement first in terms of bang for your buck. If you implement everything I talk about in this article, you should be done in under a day.
Finally, one thing to keep in mind is that there is no “one size fits all” approach to monitoring. You will want the results of your monitoring to drive what you add monitoring to next. I’ll dive further into that topic in a future blog post.
Uptime Monitoring
To start with, you’ll want to start using a good uptime-monitoring solution. These services are dead simple — they ping specific HTTP endpoints periodically from different locations around the world and report on whether they are up or not. I’m partial to Pingdom (Paid), but I’ve had good success with UptimeRobot (Freemium) as well. It’s worth noting that some APMs (e.g., NewRelic) also offer this service if you’d like to keep your monitoring stack completely self-contained within a single tool.
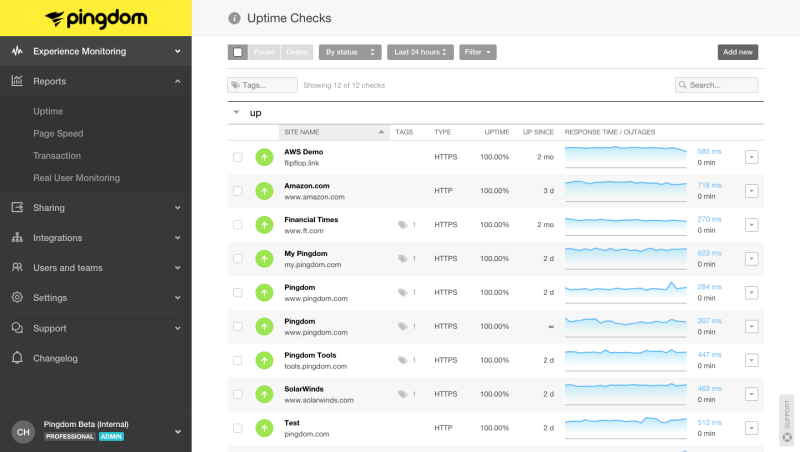
To use, simply add a list of endpoints to the service to track — for example, your homepage, sign up page and other critical pages of your app. If you are running multiple services and/or multiple domains, you’ll want to have checks on those too.
You should be able to get good coverage of your services in under 10 minutes. As far as cost is concerned, these services are relatively cheap and often free — To start out with, you won’t be paying more than $10/month. These alerts are also fairly hard to screw up — False positives are extremely rare. If our uptime monitoring reported an issue… There was always an issue. Sometimes it was external (e.g., AWS CloudFront was down), but there was always customer impact.
Because of the ease of setup, low price and “idiot-proof” nature of uptime monitoring, I’d always recommend setting up this type of monitoring first. It can tell you if your servers are overloaded, your deploys are really zero-downtime, critical third-party services are going down and more.
Application Performance Monitoring
The second most valuable piece of monitoring you can add to your applications are APM tools such as NewRelic or Scout. Often times these tools also include uptime monitoring and exception monitoring baked in, making them a truly one-stop shop.
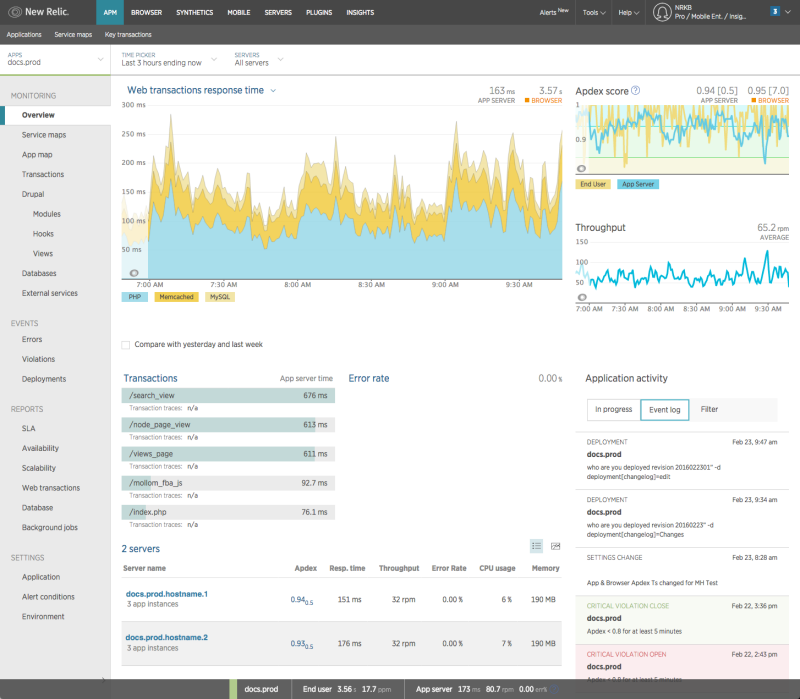
These tools usually work by adding a library and some configuration to your web application. So just like uptime monitoring, they are relatively low effort to add to your projects. APM solutions are usually free to start with, but the cost grows dramatically as you scale. Setting up meaningful alerts with these tools can also be tricky — you’ll likely have a lot of false positives as you gain experience with what these tools are telling you. The big win though that you will get instantly is deep, deep insight into your application that will help you guide your future monitoring and development efforts.
APMs will help you determine what pages are slow and why. They can help with the following questions:
- Are these pages slowing down the rest of the site by hogging all your computing resources?
- Did your latest deploy introduce a large performance regression?
- Is the database is overloaded?
- Is a key third-party service is slow?
- Did your cache unexpectedly emptied?
APMs will be the most valuable tool in your monitoring toolbox after you get past the somewhat steep learning curve and information overload. You will want to have this tool open during and after every deploy as well as when you are having outages or poor performance.
Exception Monitoring
Finally, the last piece of critical monitoring I’d ensure you have in place is exception monitoring. Many APM solutions include this, so it’s worth checking if you get it “for free” before adding in another tool. Even if your APM has something, depending on the volume of your exceptions (and quality of the APM), you might want to pull in a 3rd party to do this work for you anyway. I’ve had good experiences with Rollbar and Sentry personally, but don’t stress too much about choice here. Most solutions are really similar, so just pick one.
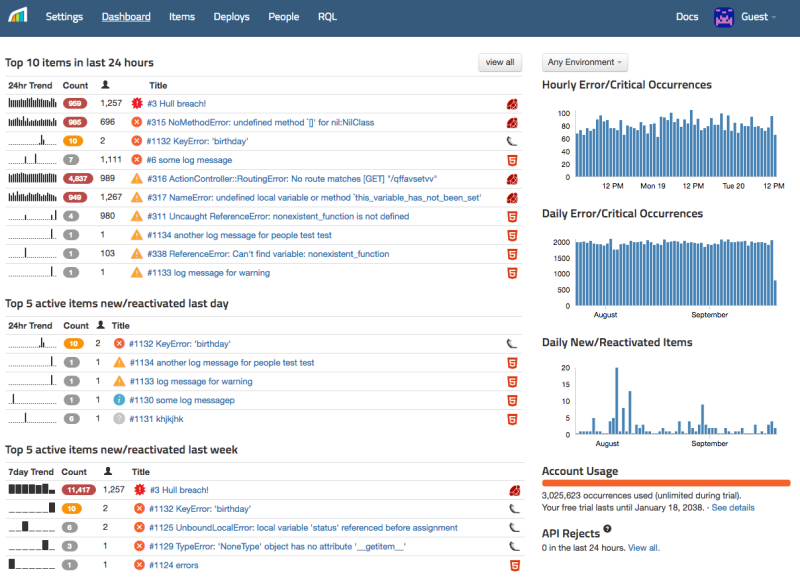
Just like APMs, these are usually just library additions that hook into your application’s global exception handlers and log failures in your app to an external service. Exception monitoring can help with some of the following:
- Easily view and search stack traces for rapid root cause analysis.
- Grouping similar exceptions so you can understand the impact.
- Integrate with your bug tracking systems so you can triage and assign bugs to developers.
- Attach metadata to your exceptions so you can see for example which users are being impacted by failures.
Exception monitoring is cheap or free at low volume and by and large, you always want to know when your application has an unhandled exception so the information is always valuable.
There is a decent amount of overlap with what an APM can tell you (e.g., if your cache is down, you will probably get exceptions from your cache connector), but for digging into specific errors that your users are seeing it’s usually hard to beat a dedicated exception monitoring interface. Just like your APM, you will want this open during and after every deploy.
Conclusion
Based on my experience running a fairly large website that was in a state of absolute disarray when we took over, these are the absolute critical pieces of monitoring infrastructure you cannot live without. There are a lot of other pieces to a successful monitoring solution that I’m planning to cover in future posts: meaningful alerting and what that means, incident management platforms, Slack-Ops and exploratory monitoring to name a few. Sign up for my mailing list if you are interested.
Any thoughts? Did I miss something? Send me an email.
Level up your devops skills as fast as you can
Get bi-weekly emails about monitoring and bring your uptime to 99.999%!
I respect your email privacy.